|
|
|
|
|
|
Frequency responses are usually measured by sweeping sine-signals as source and a display plotting the returning amplitude versus the frequency. This is quite a time-consuming method, and if low frequencies, high resolutions and/or high precision is required, it becomes even more time-consuming.
Here I introduce a technique which allows to make high precision, high resolution frequency measurements in real time, i. e., as fast as you can turn a potentiometer on your equalizer.
The idea is simple: An FFT-analyzer evaluates a complete audio spectrum within fractionals of a second (depending on the frequency resolution or the start frequency respectively). Using a signal that exactly supplies all frequencies the FFT evaluates as a test source allows to determine the whole frequency response within just that little time.
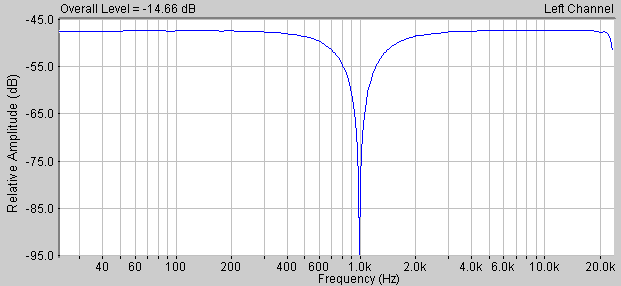
Look at the example below: This frequency response of a band-stop filter is completely measured whithin only 1 or 2 tenth of a second(!), with this high resolution and dynamic range!
For very low start frequencies and resolutions, i. e. lower than 20 Hz, the latency becomes more distinct, and for e. g. a start frequency as low as 1 Hz the full display takes 3 or 4 seconds (on my 2 GHz-PC). This is still much faster than with sweeping sine signals, not to mention precision and resolution.
But there are quite a couple of things to mind in order to make this technique work, it's not just trivial. Here I provide a couple of appropriate WAV-files to be used as source signals. Furthermore you need a PC sound system (a good one for higher demands), an audio player to reproduce the WAV-files and the FFT-software for analysis.
The PC-Sound System
It must be able to "play" and "record" simultaneously (which is not the case with some very old sound cards). Of course a good frequency response of the sound system is desirable and its abilty to work even with 96 kHz sample rate. I'm using an on-board system (just to test this technology, but apart from that rather not), a Soundblaster Audigy 2 ZS (which is good, but due to its resampler has an undesirable drawback for this application), my USB Audio-Codec and, best of all, my 24 Bit / 96 kHz Audio ADC and DAC.
The Audio Player
It must be able to reproduce the WAV-files in a seamless repeating loop. I use Winamp for that with options "Repeat" set on and "Crossfader" set off.
The FFT-Software
Its correct setup is most important - and least simple. The required settings are:
I tested with SpectraLAB, from which a one-month shareware version is available.
The WAV-Files
Here I provide several files for several sample rates and frequency resolutions (which also affect the mesuring times). They are explained further below.
Some Background Information and how the Multi-Sine Signals and WAV-Files were Generated
With an FFT-analysis the energy of each frequency of an incoming signal is evaluated for a given number of frequencies. The result is a set of "spectral lines".
With a sample rate of 48 kHz it is possible to analyse frequencies up to, but not including 24 kHz. In an FFT (audio) samples are analysed in blocks. These blocks have sizes of 2n samples, e. g. 1024 (n = 10), 2048 (n = 11) or 65536 (n = 16) samples. The output of the FFT is a set of 2n spectral lines, equally spaced. E. g., for n = 10 there are 1024 spectral lines spaced 24 kHz / 1024 = 23.4375 Hz from each other. The lowest frequency is 23.4375 Hz (except DC, which is available, but not interesting here), the highest is 23976.5625 Hz.
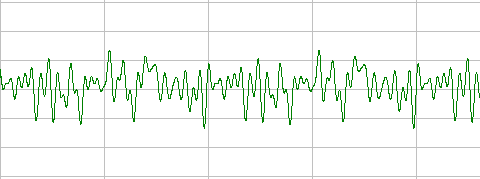
The Multi-Sine signal provides exactly all these frequencies, all with an equal amplitude (to begin with). If all single sine signals would be of equal phase, i. e. all were crossing zero at start, the remainig signal would consist of pulses only:
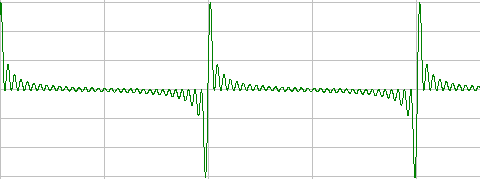
This example is for 32 (n = 5) sine waves only. Though each sine wave has an amplitude of 1, the maximum amplitude is 23, so the power of each sine wave in the signal must be less than -40 dB, which is rather low. For a more realistc block size of 1024 (n = 10) and higher it looks much worse and is not practical any more. In technical terms this is known as a very high crest factor: The relation between the peak and the average power of the signal.
By shifting the phases of the sine waves to each other, the crest factor can be reduced drastically:
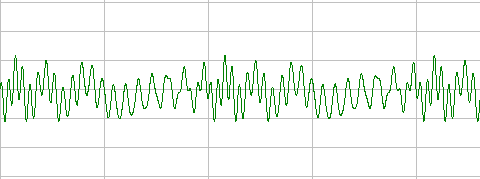
In the signal above, the same sine waves and sine amplitudes as before are present, but the crest factor is reduced by a factor of 3 approx.. Looking closely at the wave form, two superimposed sine waves seem to be sweeping downwards. Both, the multi-sine above and the following one are based on the same phase-shift algorithm, with just one paramater slightly changed:
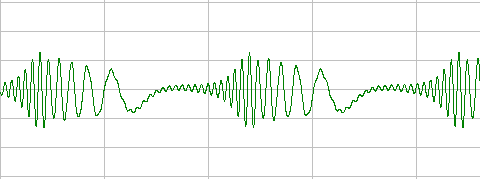
This looks more like a sweep signal, and it sounds similar, too. More accoustically interesting examples are presented below. This signal has a slightly increased crest factor compared to the one above, which looks more like white noise. Phase shifting can also be carried out randomly. The resulting signal then comes very close to white noise, but the crest factor is not that optimal:
As mentioned, one drawback of the multi-sine technique is that each sine signal has a relatively small amplitude compared to full scale. The more sine waves there are, the more resolution is available and the lower is the lowest freqency, but on the other hand, the individual amplitudes are smaller. If you have a single noise tone in your system, even if it develops a very low and even inaudiable amplitude, this may disturb your measurement.
Multi-Sine WAV-Files Provided
The WAV-files I provide here are all mono and each file is 1 MByte long. Each sample occupies 2 bytes. Each block is repeated until 1 MByte is filled. I've done this for the case that your player does not autorepeat properly (seamlessly), so that the duration of a single file is long enough to make measurements.
Most files are prepared with white spectrum, i. e. all spectral tones have the same level. This stresses tweeters extremely, and for these cases some files with pink spectrum are included. This also may be helpful if you have interfering low frequency tones, e. g. hum. But your FFT must be able to cope with a pink spectrum. Read below how to do this with SpectraLab.
Because each single tone is generated with the level named "Tone Level" in the table below, a gain of 1 of the DUT corresponds exactly to that level. If you want to normalise a gain of 1 to 0 dB, you must either add an offset to the incoming signal, or even better (because the sound system's frequency response can be compensated too), follow the normalisation procedure explained in chapter "How to Use the Pink Spectrum" below, but use a loopback from the analog output to the input instead of the file mode.
For 48 kHz I prepared another 4 files with different phase shifts. I believe these different sounds to be quite interesting, so they are meant to be listened to.
| File Name |
Sample Rate |
Spectrum | n / FFT Block Size | Resolution |
Phase Index |
Total Level |
Tone Level |
Crest Factor | Remark |
|---|---|---|---|---|---|---|---|---|---|
| MSin44W12-13.WAV | 44.1 kHz | White | 12 / 4096 | 10.8 Hz | 1.3 | -6.19 dB | -39,25 dB | 2.87 | Fast |
| MSin44W14-13.WAV | 14 / 16384 | 2.69 Hz | 1.3 | -6.66 dB | -45.74 dB | 3.03 | Universal | ||
| MSin44W16-13.WAV | 16 / 65536 | 0.673 Hz | 1.3 | -7.34 dB | -52.45 dB | 3.27 | Low frequency | ||
| MSin48W12-13.WAV | 48 kHz | 12 / 4096 | 11.7 Hz | 1.3 | -6.19 dB | -39,25 dB | 2.87 | Fast | |
| MSin48W14-13.WAV | 14 / 16384 | 2.93 Hz | 1.3 | -6.66 dB | -45.74 dB | 3.03 | Universal | ||
| MSin48W16-13.WAV | 16 / 65536 | 0.732 Hz | 1.3 | -7.34 dB | -52.45 dB | 3.27 | Low frequency | ||
| MSin96W13-13.WAV | 96 kHz | 13 / 8192 | 11.7 Hz | 1.3 | -9.79 dB | -42.48 dB | 2.94 | Fast | |
| MSin96W15-13.WAV | 15 / 32768 | 2.93 Hz | 1.3 | -10.28 dB | -49.00 dB | 3.11 | Universal | ||
| MSin96W17-13.WAV | 17 / 131072 | 0.732 Hz | 1.3 | -10.62 dB | -55.72 dB | 3.38 | Low frequency | ||
| MSin48W15-12.WAV | 48 kHz | White | 15 / 32768 | 1.46 Hz | 1.2 | -7.80 dB | -49.50 dB | 3.31 |
Compare these sounds, the differences are amazing! |
| MSin48W15-14.WAV | 1.4 | -9.43 dB | -51.16 dB | 3.99 | |||||
| MSin48W15-16.WAV | 1.6 | -11.24 dB | -52.97 dB | 4.91 | |||||
| MSin48W15Rnd.WAV |
|
-10.34 dB | -52.06 dB | 4.43 | Noise-like sound | ||||
| MSin44P13Rnd.WAV | 44.1 kHz | Pink | 13 / 8192 | 5.38 Hz | Random | -9.16 dB | - | 3.61 |
Pink spectrum as an option |
| MSin48P13Rnd.WAV | 48 kHz | 13 / 8192 | 5.89 Hz | -9.16 dB | - | 3.61 | |||
| MSin96P14Rnd.WAV | 96 kHz | 14 / 16384 | 5.89 Hz | -10.36 dB | - | 3.97 |
Note: Each file is 1 MByte long and, due to repetition of the blocks until 1 MByte is filled, can be compressed. Unfortunately WinZip is not able to handle blocks greater than 214 = 16384 bytes (= 213 = 8192 samples), so only few files could be "zipped". But WinRAR does a fine job, so here they are as a RAR archive:
All files WAV above compressed in a WinRAR archive (1 MByte)
If you setup everything correctly and analyse these files in file-mode, you will see an exact, horizontal line at the "Tone Level" noted in the table, no matter what vertical resolution you choose. The same exact line results when you analyse the digital in- and output of your sound system via a direct digital loopback cable. But the use of the analog in- and outputs will reveal their weaknesses.
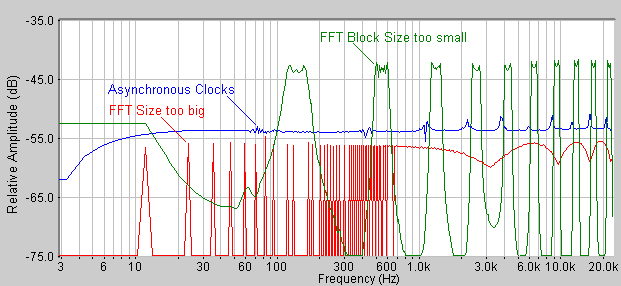
Effects of Wrong Setup
You will soon learn to know how wrong setups look like. The most common one is a different size of blocks in the wave file and the FFT size. The effects are shown below. Also shown is the effect of asynchronously running ADC-and DAC-clocks (which is actually no setup-error).
How to Use the Pink Spectrum
SpectraLab allows something called "Microphone Compensation", i. e. a means to normalise any odd frequency response. In order to normalise the pink frequency response, do not forget the correct setup, and then:
If you now drag and drop the same "pink" wave-file again on SpectraLab a horizontal spectral line will result. "White" wave files would now be inclined rising.
Effects with unsynchronised Codec-Clocks
A correct display depends on exact sample frequencies. Should the ADC and the DAC not run with the same clock, e. g., a sequence of 4096 samples is received with more or less fractionals of a clock, some kind of "dents" will appear in the frequency response. This for example happens, when your sound card incorporates a resampler circuit or when you analyse a stored signal, e from tape.
Unfortunately my wonderful high-end Soundblaster Audigy has this resampler and I can't disable it. Furthermore this resampler also modfies the digital frequency response, so I'm not very lucky with it for this application. Fortunately I have my 24 Bit / 96 kHz Audio ADCs and DACs, and they are perfect here.
| Last update: October 13th, 2015 | Questions? Suggestions? Email Me! | Uwe Beis |