|
|
|
|
|
|
Approaches to
the Design
The CM2 Block Diagram
Measurement Examples
Step Responses
Precharged Diaphragms (Electret Effect)
Large Amplitude Nonlinearity
Frequency Response Measurements
Front Grid Driven
Measurements
Practical Implementation of the CM2
The original idea was to just determine the tension of condenser microphone capsule's diaphragm by measuring the difference (or the relation) between its capacitance once with and once without an applied high bias voltage. The bias voltage causes an attraction force between diaphragm and backplate. Note that this force is proportional to the square of the voltage.
For this simple measurement a high voltage source, the capsule and a sensitive capacitance meter is sufficient:
But it turned out to be interesting to see the step response when altering the bias voltage. So by its time constant(s) e. g. the effects of the rear holes (for pressure compensation or for the directional pattern resp.) can be observed:
The capacitance measuring system in this case must be much faster than for the static system as above and it must provide an analogues output for the oscilloscope. When on my workbench this turned out to work fine the next aim came in sight: Why not measure a complete frequency response that way? Very much simplified this might look like this:
The output of the audio frequency (AF) generator is added to the bias voltage and the AC-portion of the measured capacitance value is rectified and displayed i. g. as a frequency chart on an oscilloscope. Also, the C-measurement output may directly be connected to the input of a spectrum (FFT) analyzer, which practically is to be recommended.
The block diagram of my CM2 actually looks much more complicated than those above:
Let's discuss this block diagram:
For step response measurements a square wave generator for 0.1 - 10 Hz is provided. For other signals there is the "Ext. AF" input with a nominal sensitivity of 1 Vpp or 10 Vpp switchable and 0 - 100% variable. An offset of 0 - 100% (0 - 10 V) can be added.
As the relation between force and voltage is quadratic a square root circuit can be activated so that the relation between input voltage and force becomes linear again.
In order to protect the capsule from unwanted or inadmissible high voltages a limiter follows, so that the maximum capsule voltages can be limited to 50, 100, 150 or 200 V.
Finally an output amplifier multiplies the the signal by a factor of 20 so that the 0 - 10 V signal range becomes 0 - 200 V. By the BNC-socket it may be monitored or used as source for front grid driven measurements (see below).
The capsule's capacitance is measured by applying a 2 MHz, 5 Veff sine wave signal to it and measuring the current. With a variable capacitor external capacitances of up to 300 pF can be compensated.
A current-to-voltage converter with a switchable capacitor as conversion element supplies one and the 2 MHz oscillator itself supplies the other input of the synchronous detector. The detector's sensitivity either 0.1 or 1 V/pf.
A low pass filter for the audible band follows and with the switchable gain of the output amplifier an overall sensitivity of up to 10 V/pf is achieved. The output range is +/-10 V.
Particularly at higher audio frequencies the capsule's capacitance variations and thus the variations of the capsule's current are very low. As a consequence the measured current may contain very low portions from anywhere else only. There are two such sources:
One source is the 200 V audio signal from the HV amplifier, particularly its harmonics. The synchronous detection principle helps a lot, but not sufficient. So the indicated series resonant circuit at the current probe's input acts as a band pass filter against the audio signal and, as this part is crucial, is practically is joined by another parallel resonant one.
The second unwanted current is portion of the 2 MHz measuring signal that flows into the output of the HV amplifier. Would this current be constant, this would not be a problem. But the amplifier's output changes its impedance dynamically with the AF signal and with it, the remaining portion of the of 2 MHz measuring signal signal is changed too - provided it is not kept apart from the amplifier's output. For this reason the indicated parallel resonant band stop filter is basically foreseen (which, similar as above, practically is supported by another series resonant one).
In fact, this frequency splitter turned out to be the bottleneck for measurements at higher audio frequencies.
The device is powered by 12 V DC and equipped with a DC-to-DC converter for -12 V and +240 V DC. The total consumption is 400 mA approx..
| If you are interested in the full circuit diagram and practical implementation of the device have a look at the "Practical Implementation of the CM2" page |

|
For my sample measurements I used a prototype of a large diaphragm cardioid capsule from Ralf Falk, who himself is designing a tube microphone. The diaphragm is a 1.4 µm, aluminized Mylar foil for low-voltage capacitors with a spacing of 200 µm approx.. Its capacitance is about 40 pF.
A first set of measurements was made with an "old, mistreated and worn out" diaphragm. Fortunately I do have some (= about 4 km) of this foil myself, so that I could replace the old diaphragm by a new one with a considerably higher tension for a new set of measurements.
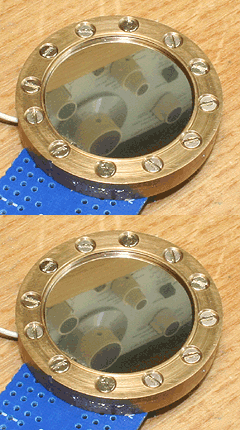
The animated picture above shows how the diaphragm shifts when it is backplate driven by a 200 V square wave.
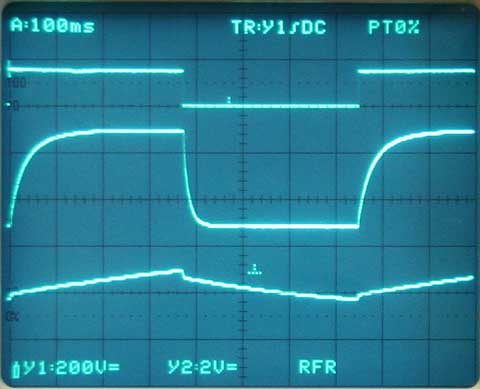
These oscillogram show the diaphragm driving voltage (0 - 150 V, top trace) and below the step response of the capsule with the old (low tension) diaphragm and all six rear holes open. Note the asymmetrical rise and fall times caused by the low tension in this measurement. The bottom trace is with all six rear holes closed so that the capsule is a pressure transducer. You could determine the capsule's lower frequency limit. You also can observe the effect of the initial air compression as a small step.
The driving voltage had to be limited to 150 V as with higher voltages the old diaphragm was fully pulled against the backplate. After I installed the new diaphragm with a considerably higher tension, the step response measurement looked like this:
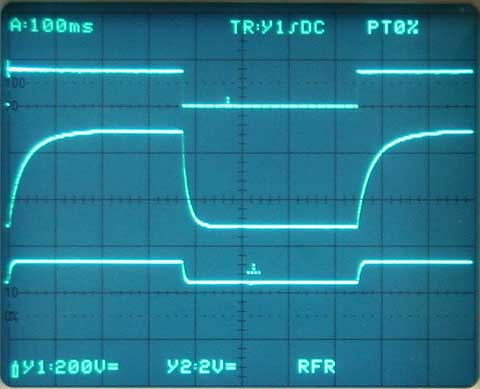
The middle trace is still stored one from the step response of the old diaphragm but the bottom trace shows the effect of the higher tension resulting in a much smaller amplitude and time constant. This of course had to be expected. Also no asymmetry is visible.
As mentioned, the old diaphragm was worn out and often, due to high driving voltage, pulled against the backplate. So it was slightly charged and an electret effect could be observed:
The driving voltage is 0 - 50 V. One can recognize that the diaphragm must be precharged by about 15 V.
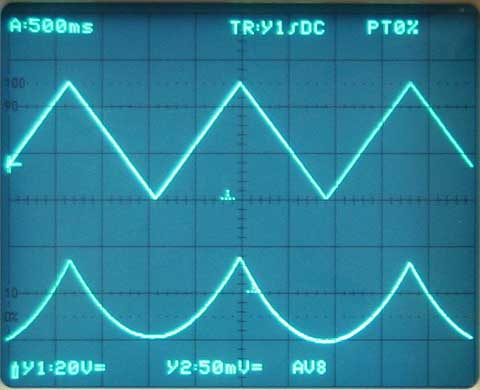
With the new diaphragm no precharge effect is visible. The response is quite ideal to the expected square function.
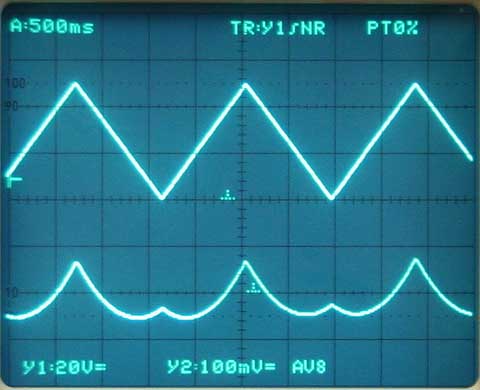
By the way, the expected ideal square function: When the diaphragm is pulled towards the backplate the field strength rises disproportionately. Driven with a triangle wave this hardly will be visible, but driven with the square root of a triangle wave, when the response itself should have a perfectly triangular shape, this effect becomes obvious (but has no relevance for the evaluation of a capsule, of course):
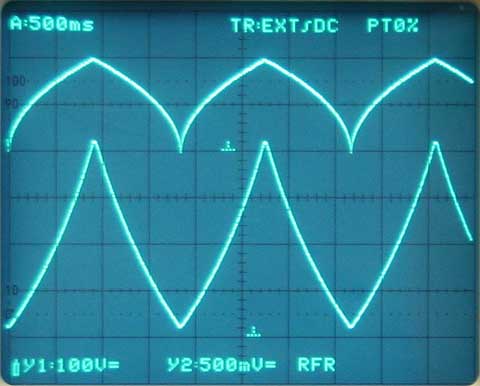
The driving voltage is 0 - 200 V (thus it must be the new diaphragm). The motion of the diaphragm in this case is easily visible.
Nevertheless, here are my current results. The first set of graphs shows measurements with both, the old an the new diaphragm.
The bottom (red) graph is recorded with fixed capacitor instead of the capsule and indicates the feed-through from the AF signal to the AF output (a kind of crosstalk, but not a direct one).
Two graphs are recorded with the old diaphragm: The upper one (purple) with all rear holes open and the lower one (green) with all of them closed. I am surprised that the holes have impact on frequencies up to and above 1 kHz - I'd expected a rather flat frequency response, clearly below the one with holes open, from zero up to the point where they would cross each other and above that frequency both frequency responses falling quite equally. OK, I learn, the equivalent circuit of a condenser capsule is distinctly different to one consisting of just one capacitor, one inductor and one resistor.
The dark yellow graph is recorded with the same set-up but with the new diaphragm with high tension. Once again I'd expected the higher tension of much less consequence, as I estimated the spring effect of the air inside much, much higher than the one of the diaphragm's tension. I still have a lot to learn!
The frequency response measurements seem to be reliable up to the frequency where the crosstalk comes close to measured signal, i. e. when measured and fed-through signals superimpose each other with an unpredictable phase. In the graphs above this may be up to 6 or 7 kHz or 3 - 5 kHz resp.. Later, with the new diaphragm, I used different settings (high DC-Voltage and low AF-voltage) and an optimal frequency splitter adjustment for that condition so that the crosstalk was drastically reduced:
This measurements at least seems to be reliable up to almost 20 kHz. The capsule's frequency response develops a maximum at 10 kHz with a couple of smaller resonances between 8 and 20 kHz. Interesting!.
It is known to put a grid very close in front of the diaphragm and supply it with the sum of the AF- and the bias-voltage. This also attracts and moves the diaphragm. The microphone's AF-output can be connected to the AF-rectifier or FFT-analyzer resp. to display the frequency response. As normally the distance between grid an diaphragm is much higher than the distance between diaphragm and backplate the force and the motion can be expected several magnitudes (quadratically) less.
One major disadvantage of the front grid driven method is that does not work down to DC when standard microphones are used. So it is not suitable to the original intention to measure step responses.
With its grid drive output the CM2 supports these kinds of measurements too, and so finally I made some (not very satisfactory) experiments with front grid driven frequency response measurements. Therefore I connected the capsule to my RF-condenser microphone circuit:

The photo above is a little bit of a delusion as in reality I had to shield the electronics from the HV-carrying grid, otherwise the AF directly was fed through to the AF output.
These measurements turned out to be little reproducible, i. e., each measurement looked more or less different from the other ones. They partially resembled the backplate driven measurements, but not as much as I would expect it. I did not spend much time on it.
From the grid driven measurements are in so far different from backplate driven ones as the electrostatic field is widely homogeneous distributed over the diaphragm's surface while between backplate and diaphragm no field or force resp. is developed in the areas of bores.
One thing I experienced is that in practice using this method the measurement on a low frequency microphone must be very difficult: Though I used an RF-circuit, which at the capsule's connections is not at all susceptible to low frequency and the low-frequency part of the circuit itself is of low resistance and "far away" from the capsule, I had to separate the electronics from the capsule quite clearly and additionally shield it. Imagine after all these experiences how perfect the shielding of a low frequency microphone's high impedance circuit must be. I wouldn't bet that the conductivity of the diaphragm's coating is sufficient. Capsules with partially metalized diaphragms cannot be measured with the grid driven method at all.
The way to find out if the shielding is sufficient is simple: Feed the grid with a DC-free AC- (AF-) signal. As the force is quadratic to the voltage, the diaphragm ideally would respond with a sine wave of twice the frequency of the AF-signal. Signals containing the original AF frequency are remaining crosstalk or feed-through.
This an experimental project, "just for fun". Should you work on something where this project is interesting, i. e. on microphones, or should it be interested for you anyhow else, I'd appreciate your feed-back. So you are very welcomed to email me!
| Last update: October 13th, 2015 |

|
Uwe Beis |