 Hands off the FNIRSI 1013DHands off the FNIRSI 1013D
... in practice it is only useful in exceptional cases.
Addendum after 16 months: I learned about an open source firmware that is relatively easy to install. I do not know it. As of today, it may still have small weaknesses, but I assume that it will be continuously improved:
https://github.com/pecostm32/FNIRSI_1013D_Firmware
中文版本。FNIRSI-1013D_cn.html
Deutsche Version: FNIRSI-1013D_de.html
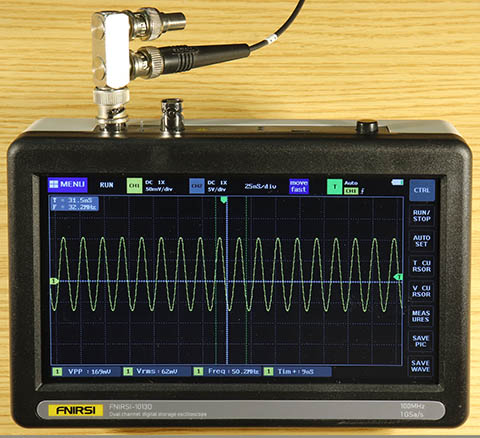
An oscilloscope with 2 channels, (allegedly) 100 MHz/1 GSa/s, portable, with decent display size, incl. 2 probes for not much more than 100 € can't be a bad buy, even if not everything is perfect.
I thought so. Even that the 100 MHz can not be true, was foreseeable before. More than 40 MHz cannot be possible, because the ADCs work with max. 200 MHz. So these specification had to be flat lies. But when is the range up to 100 MHz ever important for constantly changing measurement tasks? And this is also true for many other special functions. So for the small benefit at the price, I can gladly do without it. If then the rest works reasonably.
But it does not. The FNIRSI-1013D has such big quirks that I consider it unusable. Yes, not limited usable, but completely unusable.
I won't even mention here many small details that are missing, that are not perfect or correct. That would only distract from the two features I'm focusing on here, each of which alone make for unusability:
1. the small signal behavior and 2. the undersampling.
The random sampling should also be mentined, because that is why the representation of fast and variable signals is also not possible. In addition, a software error, which occasionally causes a discontinuous representation on the time axis, seems to be an important issue to me.
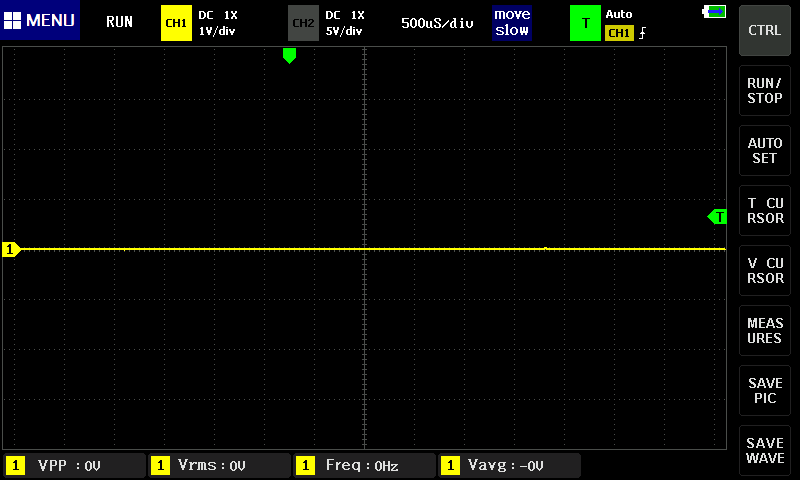
It sounds incredible, but DC voltages between +35 mV and -35 mV or AC signals with less than 35 mVpp cannot be displayed. (DC means: Largely constant during a deflection period, e.g. at 1 kHz signal frequency and a time base setting of 1 µs/div). More precisely: DC signals which do not exceed or fall below the 0-line of the channel either positively or negatively 0.7 divisions are switched off. A plane 0-line appears. This is 17% of the total image height! For AC signals it is +/- 0.35 divisions or 8% display height. This applies at the highest sensitivity of 50 mV/div and is eventually less at other settings, but in principle the same. I don't think this is a bug in the firmware, but intentional, because such severe errors are noticed immediately. This is completely absurd, you can't work with it. Not at all.
Here are the screenshots:
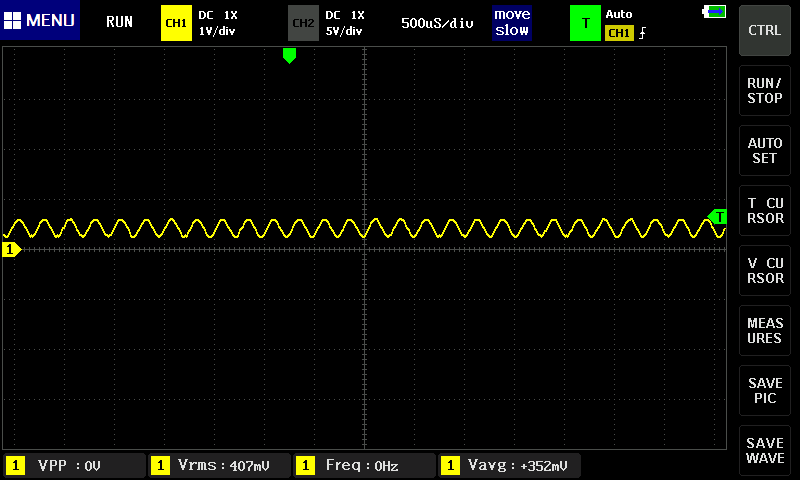
This signal with an amplitude of about 0.4 divisions and a slight DC offset of about 0.3 divisions is at the limit of what can be displayed. Sometimes a pixel or measured value exceeds the threshold - then it is visible (above). Sometimes the threshold is just not exceeded, then the 0-line is displayed (below):

As said, nothing was changed at the input signal or otherwise between these two screenshots. I just pressed the "SAVE PIC" button twice.
In the negative range the same applies: Sometimes the signal is not displayed...
... sometimes it is visible:
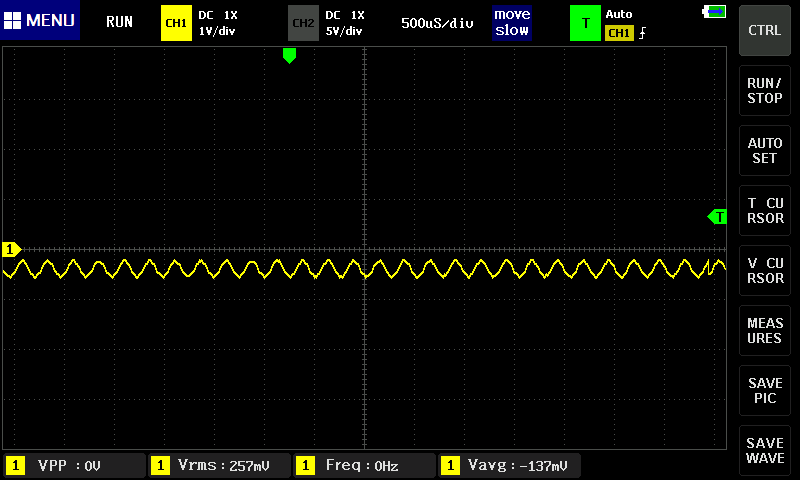
At the right edge of the image a discontinuity of the signal can be seen. This is not a coincidence, it is the next problem:
This is an effect that I cannot provoke, but which sometimes occurs and then cannot be eliminated even by switching off the device. Signals then look like this:
It also happens that the right range comes from a signal from a previous measurement, so it does not match the current, left range at all. Woe to the one who wants to examine a pulse sequence with this effect!
"If I can display only 720 samples from the X-axis, I need to sample the signal only 720 times in this time" probably thought the developers. Or the hardware did not allow what is necessary to avoid what happens then, and what does not happen with any other oscilloscope as a matter of course.
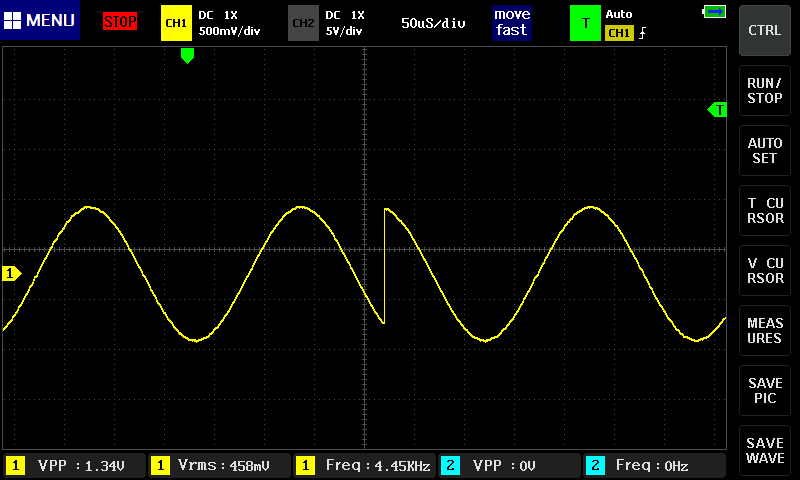
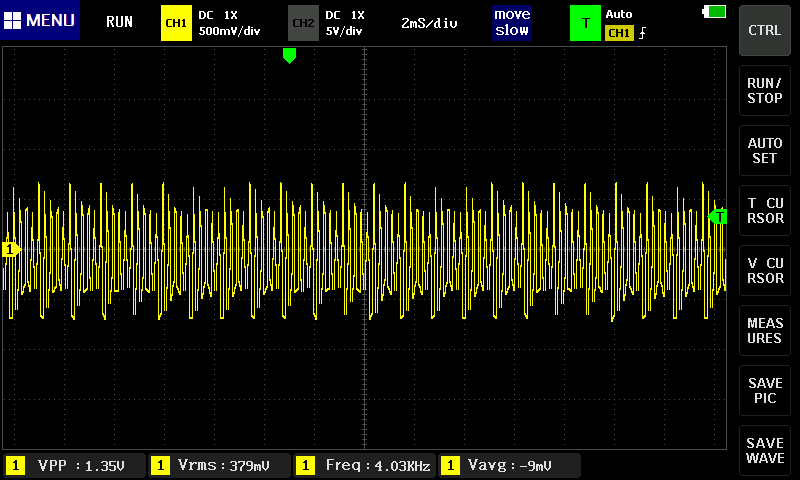
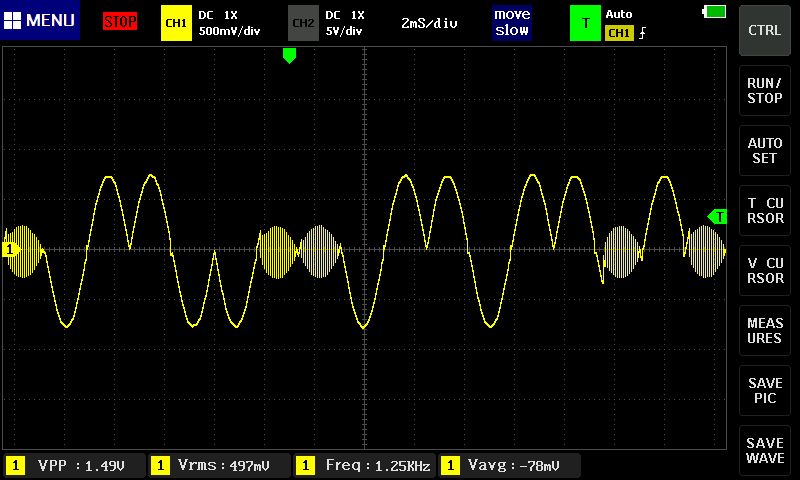
Example: Time base 2 ms/div, sine signal with 1 kHz to > 10 kHz:
First 1 kHz, that looks decent:
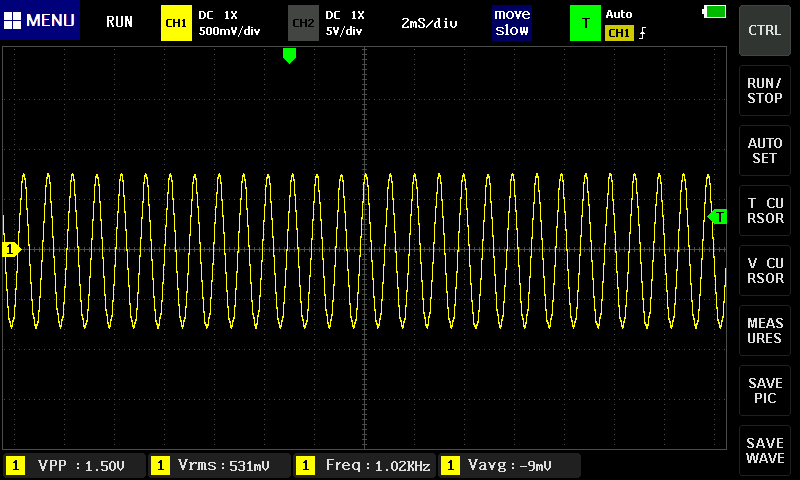
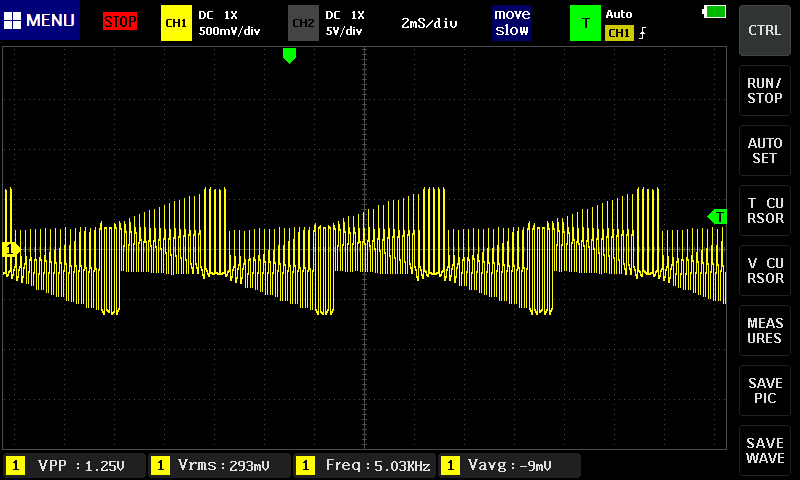
2 kHz are already unclean:
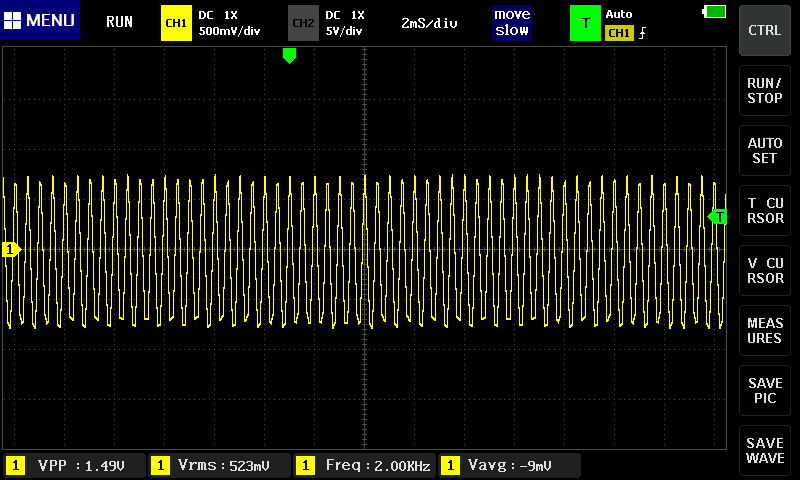
At 3 kHz, no sine can be guessed anymore. Typical, not only in these tests: The peaks are pronounced at the top, but flattened(?) at the bottom:
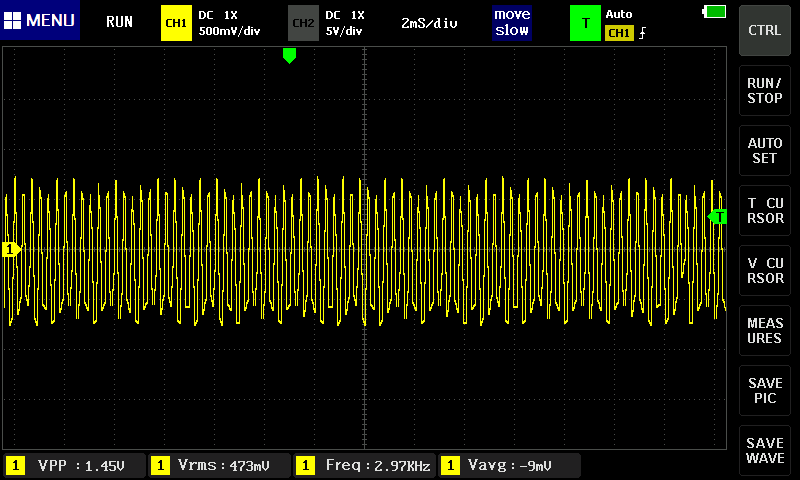
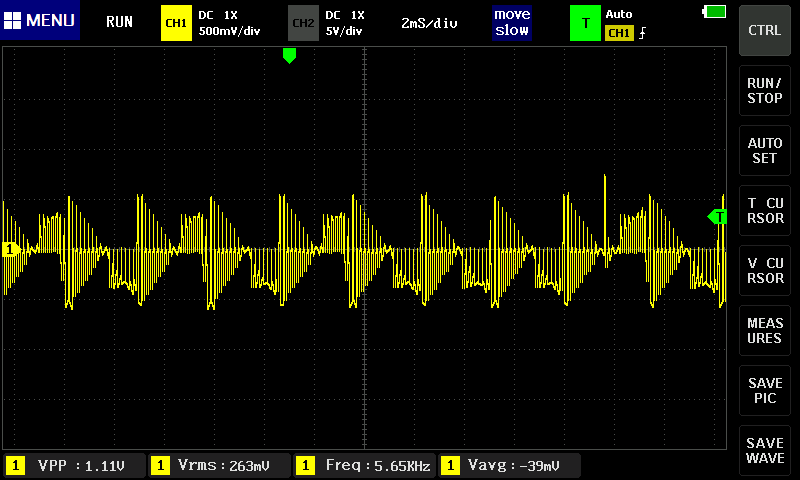
At 4 kHz it becomes almost funny, but with simple undersampling this is no longer explainable:
And 5 kHz looks rather absurd, and here at the latest it becomes clear that this is not normal textbook undersampling, with the expected alias effect:
Just for fun, another 6 kHz:
... and 7 kHz:

Now still 12 kHz:
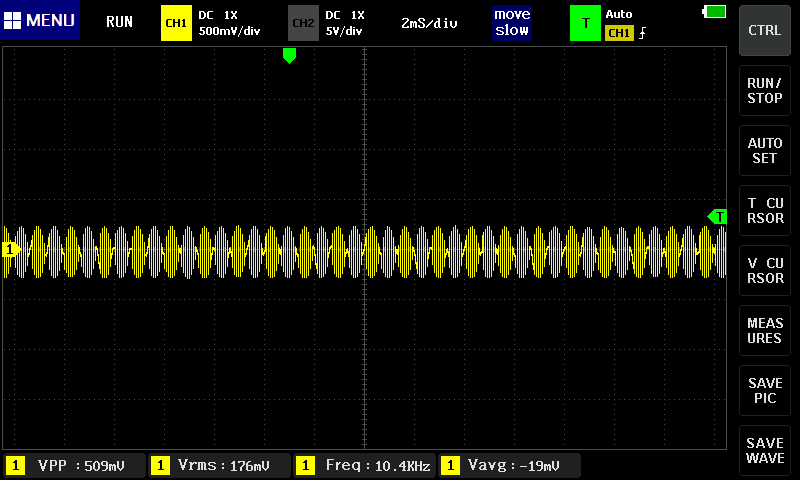
... and because the effect is so cute: screenshot at about 36 kHz, but at 13 kHz the same can be observed.
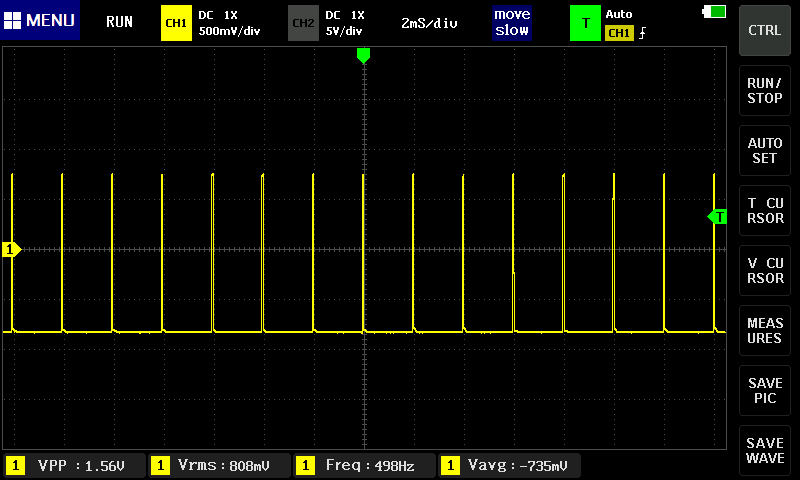
Another effect of "ruthless undersampling" is that short pulses are completely swallowed. The example first shows a 500 Hz pulse with 100 µs pulse duration, which is completely captured at 2 ms/div:
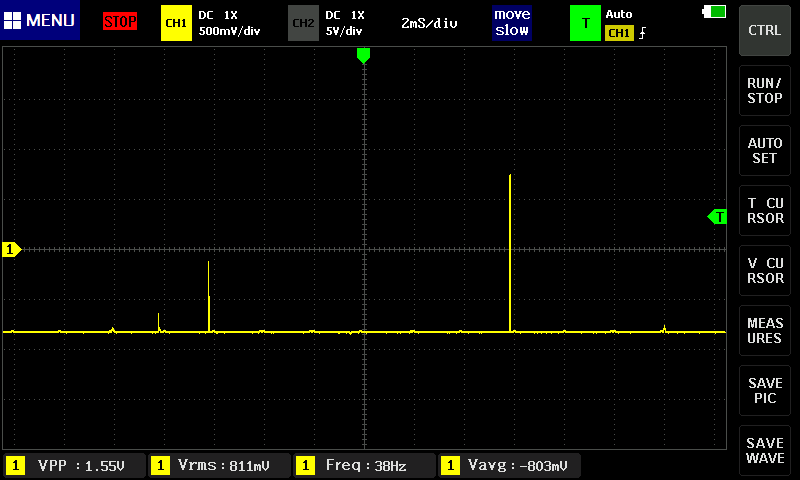
But even at only 50 µs pulse duration, most of the pulses are completely lost, although at least half should still be visible:
Random sampling is used at higher frequencies. This means that a single "shot" is not recorded at the maximum sampling rate, but that the signal is recorded several times with a slightly offset sampling phase, so that intermediate values can also be determined. For this, of course, the bandwidth in the analog section must be high enough, and the ADC must have a correspondingly low sample-and-hold time. Thus, at least in principle, it is possible to achieve sample rates of 1 GHz and bandwidths of 100 MHz even with a 200 MHz ADC.
The decisive disadvantage is: Several, identical waveforms have to be sampled. This no longer works with a single pulse train. In the 1013D, despite the extremely short times in principle, you can watch how, for example, when switching the signal frequency, the new waveform gradually emerges within about one second. Like on this screenshot:
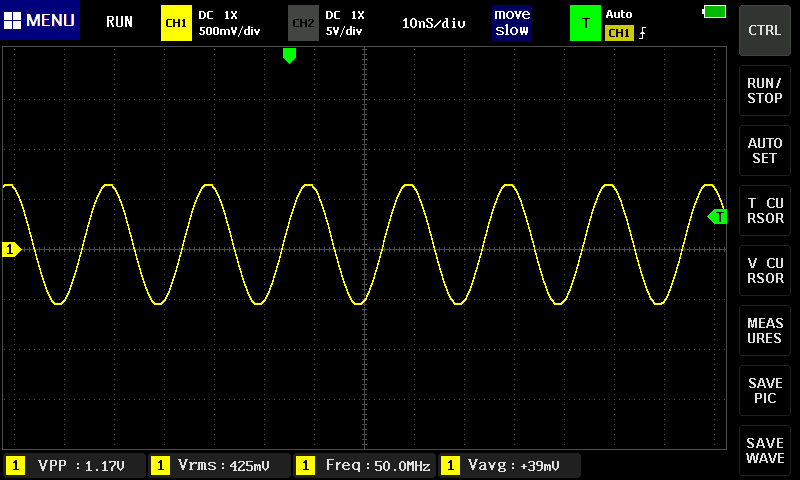
Accordingly, no recording of a slow sweep from e.g. 0 to 50 MHz, as my function generator can provide, is possible to determine the bandwidth. So at best the bandwidth can be determined with single sine signals. The following is a 50 MHz sinusoidal signal with a different time base:
At 10 ns/div the waveform is correct and also the amplitude(!). But this is not very meaningful, and only interesting for measurements of continuous signals.
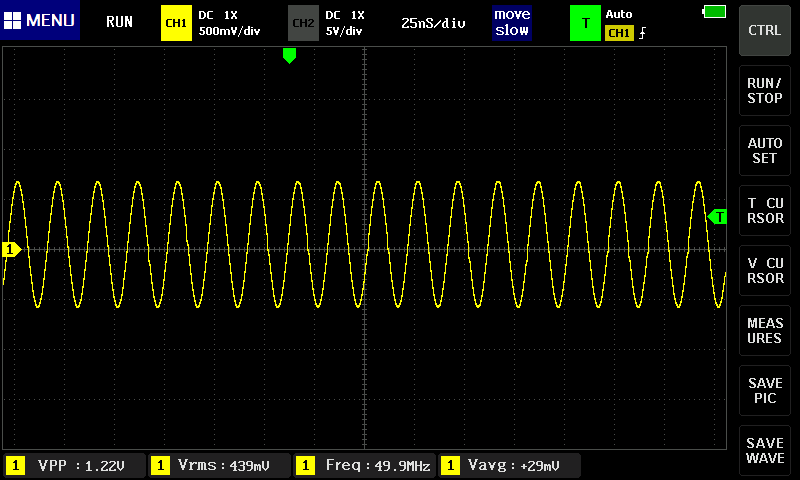
At 25 ns/div it still looks good:
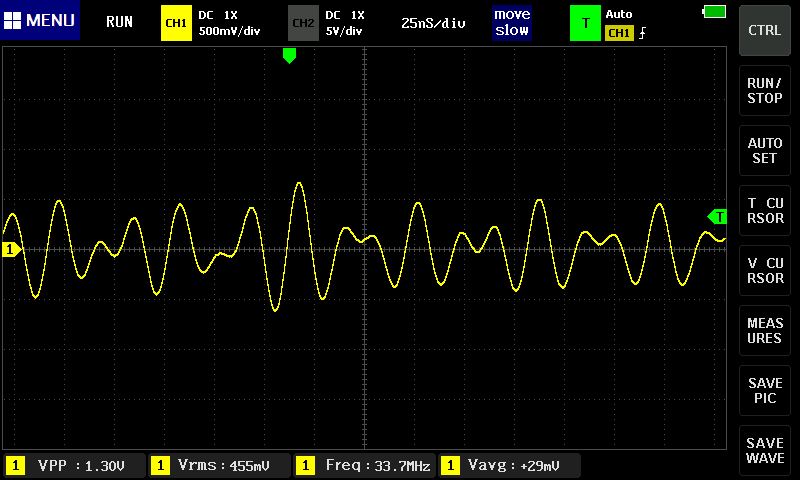
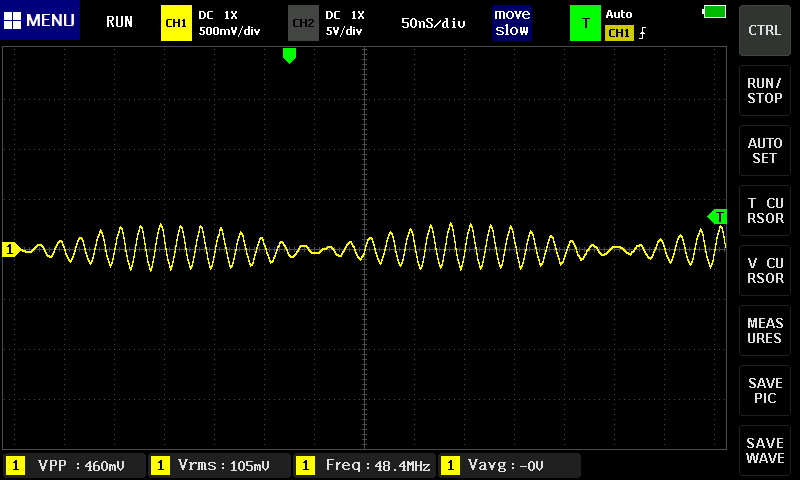
... but at 50 ns/div again nonsense can be seen:
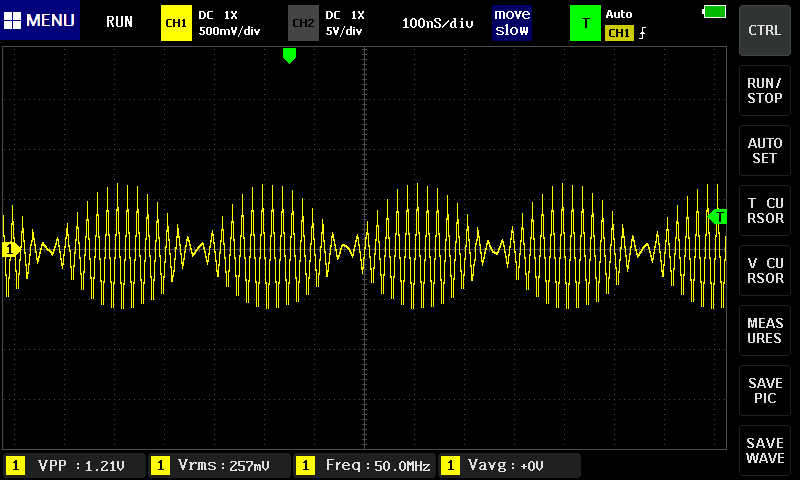
At timebase settings of 100 ns/div and more, random sampling is no longer applied. This, not surprisingly, does not make it any better:
Another attempt at bandwidth: the source is a square wave signal, about 8 Mhz, with 7 ns rise time:
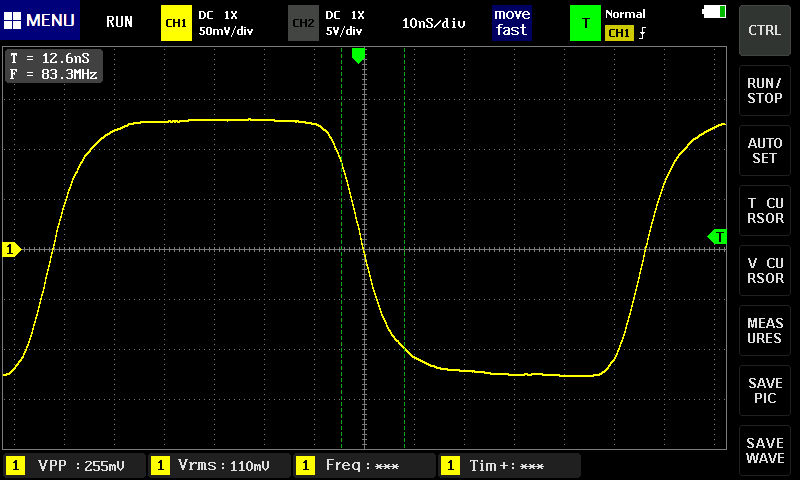
According to the calculation t_Gen² + t_Scope² = t_Disp², i.e. t_Scope = sqrt(t_Disp²-t_Gen²), the displayed rise time of approx. 12.5 ns suggests a rise time of the 1013D of approx. 10.5 ns, which in turn would correspond to approx. 30 MHz Y-bandwidth.
Another annoying and incomprehensible, but in case of doubt still tolerable property of the 1013D should be pointed out: The ground of the USB connector is not on the potential of the ground of the BNC sockets. As soon as e.g. a source with protective earth and at the same time the 1013D is connected to a PC via USB, this causes a considerable Y-shift of the measured values towards the negative. You just have to know it and disconnect USB when you continue with measurments.
It could be a really nice and useful device. An unbeatable price/performance ratio, wonderful for frugal beginners as an entry-level device and for the professionals as a second or third device when portability is needed or the main device is tied up somewhere and/or performance is not decisive.
If the development hadn't been stopped at some point, a bit too early and with bitter consequences, before it was finished... What a pity!
... after I had sent among other things also a video:
So I am a complete idiot. Ok, understood.
| Last update: May 16th, 2022 | Questions? Suggestions? Email Me! | Uwe Beis |